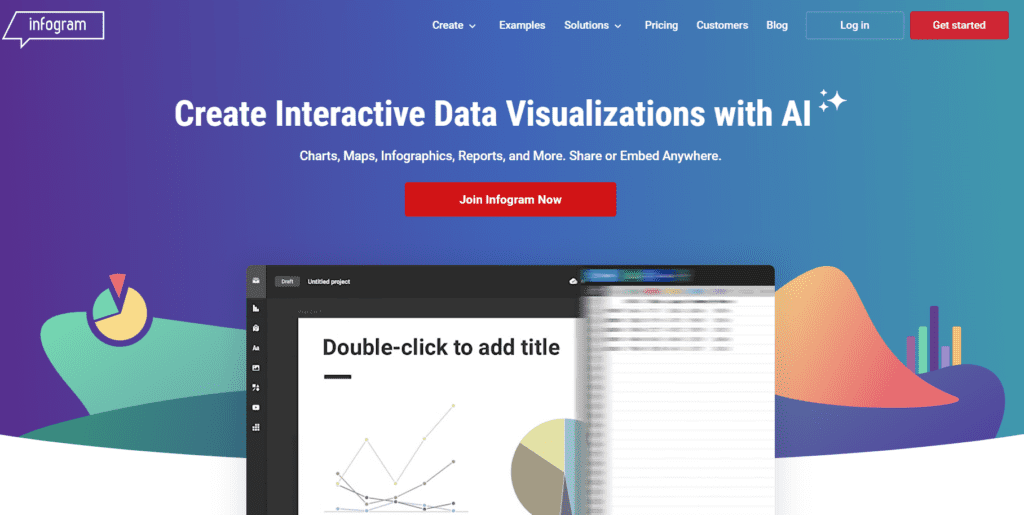
Discover how Infogram can elevate your data presentation game. Explore a World of Charts, Maps, Infographics, and Reports. Seamlessly Share or Integrate Across Platforms.
Who is Infogram For?
Infogram is a versatile tool designed for professionals across various fields including marketing, education, business, and journalism. Whether you’re a data analyst looking to present complex data clearly, or a content creator aiming to engage your audience with interactive visuals, Infogram is your go-to solution.
Pricing Plans
Infogram offers a range of pricing plans to suit different needs and budgets:
- Basic: Start for free with limited features, perfect for personal use.
- Pro: At $19/month (billed yearly), get more projects, premium templates, and privacy control.
- Business: For $67/month (billed yearly), add your brand kit and enjoy unlimited pages per project.
- Team: At $149/month (billed yearly), collaborate in real-time and access engagement analytics.
- Enterprise: Custom solutions for large organizations, including priority support and custom design implementation.
Special pricing is available for educational organizations, nonprofits, and startups.
Key Features
Infogram’s feature set is designed to make data visualization easy and impactful:
- Over 35 interactive chart types and 550+ maps.
- Access to 1 million images and icons for your projects.
- Drag-and-drop editor for easy customization.
- Interactive charts and maps to engage your audience.
- Team collaboration tools for efficient workflow.
With these features, Infogram helps you create infographics, charts, and reports that are not only visually appealing but also interactive and informative.
PRICE MODEL: FREE/PAID


